 Add to Chrome
 Add to Firefox
 Add to Edge
Wetland mapping from sparse annotations with satellite image time series and temporal-aware segment anything model
Jan 16, 2026Accurate wetland mapping is essential for ecosystem monitoring, yet dense pixel-level annotation is prohibitively expensive and practical applications usually rely on sparse point labels, under which existing deep learning models perform poorly, while strong seasonal and inter-annual wetland dynamics further render single-date imagery inadequate and lead to significant mapping errors; although foundation models such as SAM show promising generalization from point prompts, they are inherently designed for static images and fail to model temporal information, resulting in fragmented masks in heterogeneous wetlands. To overcome these limitations, we propose WetSAM, a SAM-based framework that integrates satellite image time series for wetland mapping from sparse point supervision through a dual-branch design, where a temporally prompted branch extends SAM with hierarchical adapters and dynamic temporal aggregation to disentangle wetland characteristics from phenological variability, and a spatial branch employs a temporally constrained region-growing strategy to generate reliable dense pseudo-labels, while a bidirectional consistency regularization jointly optimizes both branches. Extensive experiments across eight global regions of approximately 5,000 km2 each demonstrate that WetSAM substantially outperforms state-of-the-art methods, achieving an average F1-score of 85.58%, and delivering accurate and structurally consistent wetland segmentation with minimal labeling effort, highlighting its strong generalization capability and potential for scalable, low-cost, high-resolution wetland mapping.
Democratizing planetary-scale analysis: An ultra-lightweight Earth embedding database for accurate and flexible global land monitoring
Jan 16, 2026The rapid evolution of satellite-borne Earth Observation (EO) systems has revolutionized terrestrial monitoring, yielding petabyte-scale archives. However, the immense computational and storage requirements for global-scale analysis often preclude widespread use, hindering planetary-scale studies. To address these barriers, we present Embedded Seamless Data (ESD), an ultra-lightweight, 30-m global Earth embedding database spanning the 25-year period from 2000 to 2024. By transforming high-dimensional, multi-sensor observations from the Landsat series (5, 7, 8, and 9) and MODIS Terra into information-dense, quantized latent vectors, ESD distills essential geophysical and semantic features into a unified latent space. Utilizing the ESDNet architecture and Finite Scalar Quantization (FSQ), the dataset achieves a transformative ~340-fold reduction in data volume compared to raw archives. This compression allows the entire global land surface for a single year to be encapsulated within approximately 2.4 TB, enabling decadal-scale global analysis on standard local workstations. Rigorous validation demonstrates high reconstructive fidelity (MAE: 0.0130; RMSE: 0.0179; CC: 0.8543). By condensing the annual phenological cycle into 12 temporal steps, the embeddings provide inherent denoising and a semantically organized space that outperforms raw reflectance in land-cover classification, achieving 79.74% accuracy (vs. 76.92% for raw fusion). With robust few-shot learning capabilities and longitudinal consistency, ESD provides a versatile foundation for democratizing planetary-scale research and advancing next-generation geospatial artificial intelligence.
A comprehensive review of remote sensing in wetland classification and mapping
Apr 15, 2025Wetlands constitute critical ecosystems that support both biodiversity and human well-being; however, they have experienced a significant decline since the 20th century. Back in the 1970s, researchers began to employ remote sensing technologies for wetland classification and mapping to elucidate the extent and variations of wetlands. Although some review articles summarized the development of this field, there is a lack of a thorough and in-depth understanding of wetland classification and mapping: (1) the scientific importance of wetlands, (2) major data, methods used in wetland classification and mapping, (3) driving factors of wetland changes, (4) current research paradigm and limitations, (5) challenges and opportunities in wetland classification and mapping under the context of technological innovation and global environmental change. In this review, we aim to provide a comprehensive perspective and new insights into wetland classification and mapping for readers to answer these questions. First, we conduct a meta-analysis of over 1,200 papers, encompassing wetland types, methods, sensor types, and study sites, examining prevailing trends in wetland classification and mapping. Next, we review and synthesize the wetland features and existing data and methods in wetland classification and mapping. We also summarize typical wetland mapping products and explore the intrinsic driving factors of wetland changes across multiple spatial and temporal scales. Finally, we discuss current limitations and propose future directions in response to global environmental change and technological innovation. This review consolidates our understanding of wetland remote sensing and offers scientific recommendations that foster transformative progress in wetland science.
Optimizing and Fine-tuning Large Language Model for Urban Renewal
Nov 27, 2023


This study aims to innovatively explore adaptive applications of large language models (LLM) in urban renewal. It also aims to improve its performance and text generation quality for knowledge question-answering (QA) tasks. Based on the ChatGLM, we automatically generate QA datasets using urban renewal scientific literature corpora in a self-instruct manner and then conduct joint fine-tuning training on the model using the Prefix and LoRA fine-tuning methods to create an LLM for urban renewal. By guiding the LLM to automatically generate QA data based on prompt words and given text, it is possible to quickly obtain datasets in the urban renewal field and provide data support for the fine-tuning training of LLMs. The experimental results show that the joint fine-tuning training method proposed in this study can significantly improve the performance of LLM on the QA tasks. Compared with LoRA fine-tuning, the method improves the Bleu and Rouge metrics on the test by about 5%; compared with the model before fine-tuning, the method improves the Bleu and Rouge metrics by about 15%-20%. This study demonstrates the effectiveness and superiority of the joint fine-tuning method using Prefix and LoRA for ChatGLM in the urban renewal knowledge QA tasks. It provides a new approach for fine-tuning LLMs on urban renewal-related tasks.
A global product of fine-scale urban building height based on spaceborne lidar
Oct 22, 2023


Characterizing urban environments with broad coverages and high precision is more important than ever for achieving the UN's Sustainable Development Goals (SDGs) as half of the world's populations are living in cities. Urban building height as a fundamental 3D urban structural feature has far-reaching applications. However, so far, producing readily available datasets of recent urban building heights with fine spatial resolutions and global coverages remains a challenging task. Here, we provide an up-to-date global product of urban building heights based on a fine grid size of 150 m around 2020 by combining the spaceborne lidar instrument of GEDI and multi-sourced data including remotely sensed images (i.e., Landsat-8, Sentinel-2, and Sentinel-1) and topographic data. Our results revealed that the estimated method of building height samples based on the GEDI data was effective with 0.78 of Pearson's r and 3.67 m of RMSE in comparison to the reference data. The mapping product also demonstrated good performance as indicated by its strong correlation with the reference data (i.e., Pearson's r = 0.71, RMSE = 4.60 m). Compared with the currently existing products, our global urban building height map holds the ability to provide a higher spatial resolution (i.e., 150 m) with a great level of inherent details about the spatial heterogeneity and flexibility of updating using the GEDI samples as inputs. This work will boost future urban studies across many fields including climate, environmental, ecological, and social sciences.
Incorporating Deep Features in the Analysis of Tissue Microarray Images
Nov 26, 2018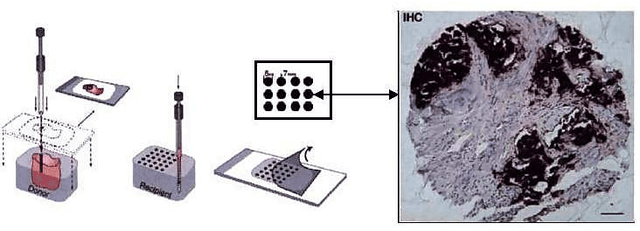
Tissue microarray (TMA) images have been used increasingly often in cancer studies and the validation of biomarkers. TACOMA---a cutting-edge automatic scoring algorithm for TMA images---is comparable to pathologists in terms of accuracy and repeatability. Here we consider how this algorithm may be further improved. Inspired by the recent success of deep learning, we propose to incorporate representations learnable through computation. We explore representations of a group nature through unsupervised learning, e.g., hierarchical clustering and recursive space partition. Information carried by clustering or spatial partitioning may be more concrete than the labels when the data are heterogeneous, or could help when the labels are noisy. The use of such information could be viewed as regularization in model fitting. It is motivated by major challenges in TMA image scoring---heterogeneity and label noise, and the cluster assumption in semi-supervised learning. Using this information on TMA images of breast cancer, we have reduced the error rate of TACOMA by about 6%. Further simulations on synthetic data provide insights on when such representations would likely help. Although we focus on TMAs, learnable representations of this type are expected to be applicable in other settings.
Probabilistic graphical model based approach for water mapping using GaoFen-2 (GF-2) high resolution imagery and Landsat 8 time series
Dec 22, 2016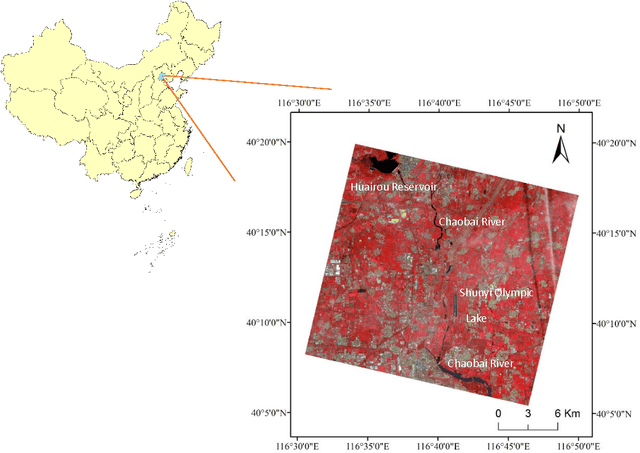
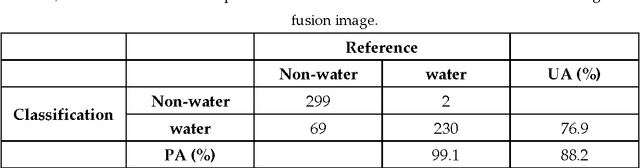
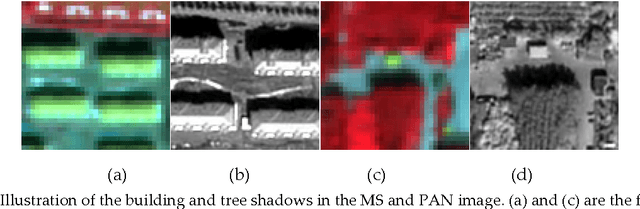
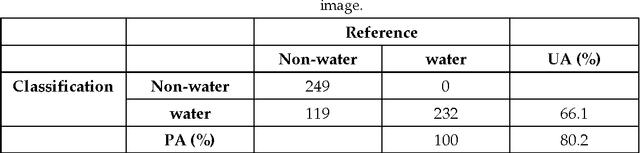
The objective of this paper is to evaluate the potential of Gaofen-2 (GF-2) high resolution multispectral sensor (MS) and panchromatic (PAN) imagery on water mapping. Difficulties of water mapping on high resolution data includes: 1) misclassification between water and shadows or other low-reflectance ground objects, which is mostly caused by the spectral similarity within the given band range; 2) small water bodies with size smaller than the spatial resolution of MS image. To solve the confusion between water and low-reflectance objects, the Landsat 8 time series with two shortwave infrared (SWIR) bands is added because water has extremely strong absorption in SWIR. In order to integrate the three multi-sensor, multi-resolution data sets, the probabilistic graphical model (PGM) is utilized here with conditional probability distribution defined mainly based on the size of each object. For comparison, results from the SVM classifier on the PCA fused and MS data, thresholding method on the PAN image, and water index method on the Landsat data are computed. The confusion matrices are calculated for all the methods. The results demonstrate that the PGM method can achieve the best performance with the highest overall accuracy. Moreover, small rivers can also be extracted by adding weight on the PAN result in PGM. Finally, the post-classification procedure is applied on the PGM result to further exclude misclassification in shadow and water-land boundary regions. Accordingly, the producer's, user's and overall accuracy are all increased, indicating the effectiveness of our method.
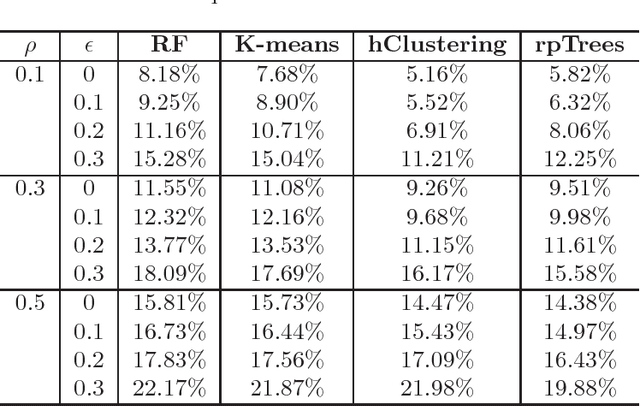
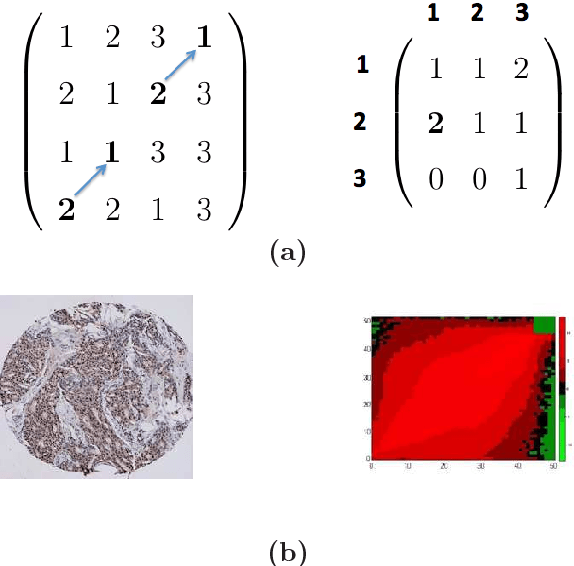
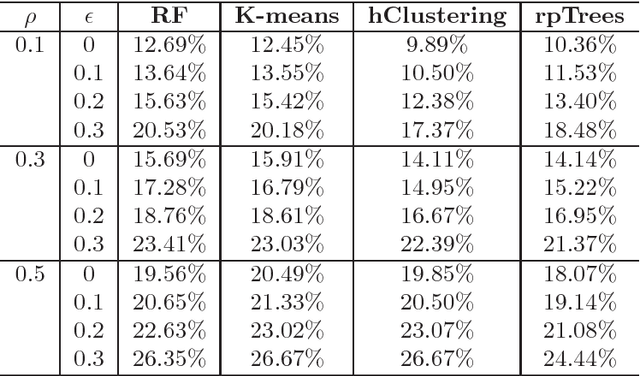
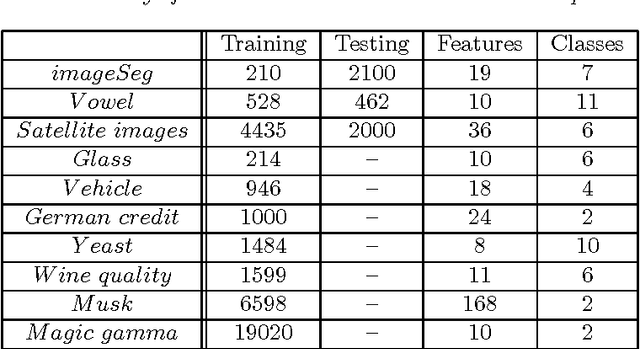
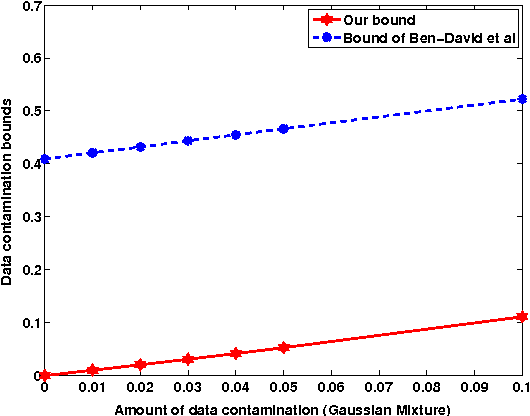
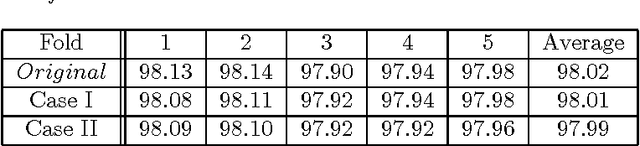
Classification under Data Contamination with Application to Remote Sensing Image Mis-registration
Jan 05, 2012
This work is motivated by the problem of image mis-registration in remote sensing and we are interested in determining the resulting loss in the accuracy of pattern classification. A statistical formulation is given where we propose to use data contamination to model and understand the phenomenon of image mis-registration. This model is widely applicable to many other types of errors as well, for example, measurement errors and gross errors etc. The impact of data contamination on classification is studied under a statistical learning theoretical framework. A closed-form asymptotic bound is established for the resulting loss in classification accuracy, which is less than $\epsilon/(1-\epsilon)$ for data contamination of an amount of $\epsilon$. Our bound is sharper than similar bounds in the domain adaptation literature and, unlike such bounds, it applies to classifiers with an infinite Vapnik-Chervonekis (VC) dimension. Extensive simulations have been conducted on both synthetic and real datasets under various types of data contamination, including label flipping, feature swapping and the replacement of feature values with data generated from a random source such as a Gaussian or Cauchy distribution. Our simulation results show that the bound we derive is fairly tight.